Stadum Family Archive · Experimental Visualization
Labs
Standalone tests for data visualization tools applied to the Stadum family archive. Map, timeline, graph, table, gallery — each experiment uses real family data.
Experiments
Edit mode: drag cards by the handle, then use Save Page to persist the new order.
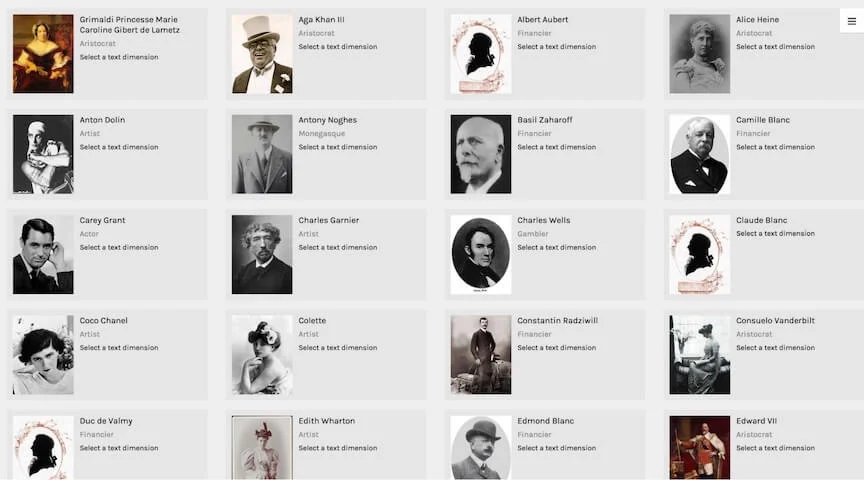
D3 Force Graph · Palladio-Inspired
D3 v7 force-directed network of Stadum family relationships and place connections. People and place nodes linked by born-in, lived-in, parent-of, and married-to relationships — filterable by type.
Interactive
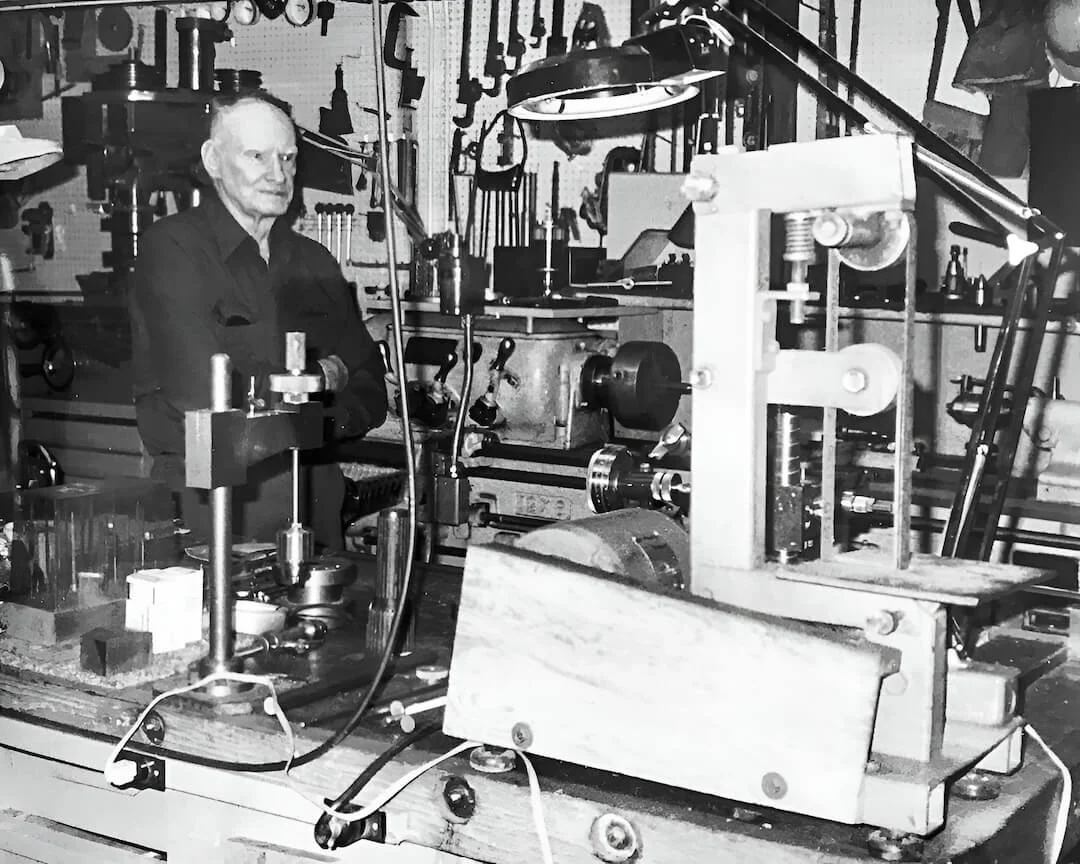
Interactive Narrative
An experimental non-linear navigation flow inspired by Google Living Stories. Features D3.js force graphs, scrollytelling maps, off-canvas events, and image interest points.
New Demo
Humanities + Design Lab · Stanford
Five-view explorer for historical data: Map, Graph, Table, Gallery, and Timelines. Upload the family CSV and explore generational patterns, place networks, and relationship graphs.
Ready to launch
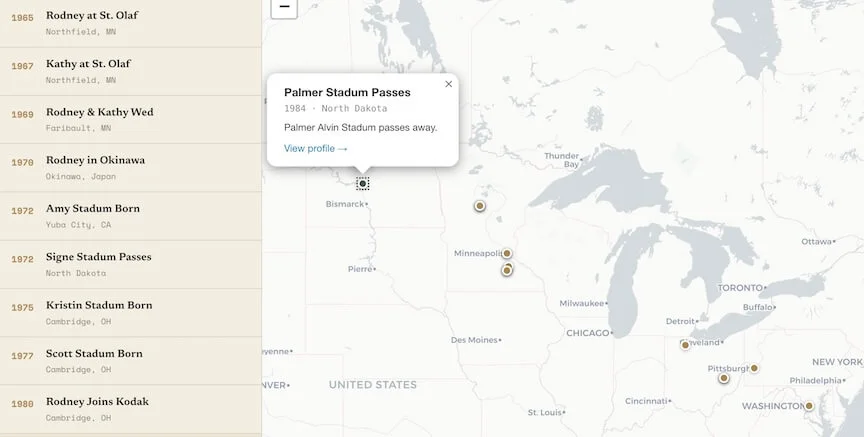
Open Knowledge Foundation
Side-by-side timeline + world map for family events. 40+ events from Palmer's birth in 1912 to Dean's birth in 2025 — scroll through generations while watching the map animate.
Live embed
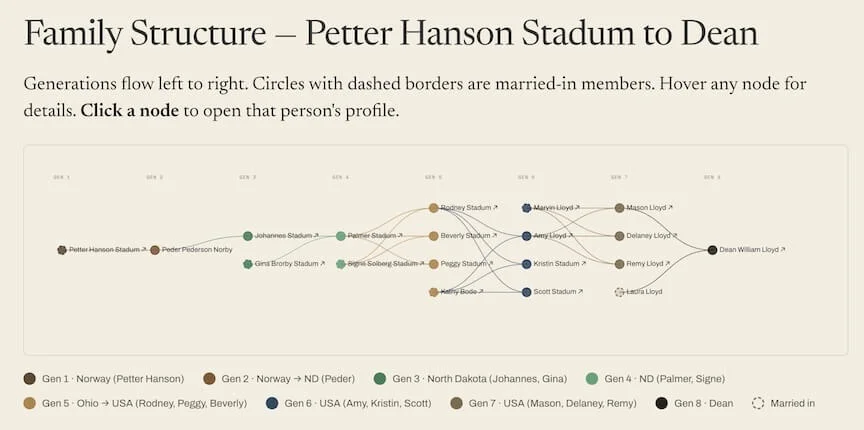
D3.js v7 · Family Tree
Directed acyclic graph showing the Stadum family from Johannes to Dean. Each person can have two parents, revealing where bloodlines and marriages converge into new generations.
Interactive
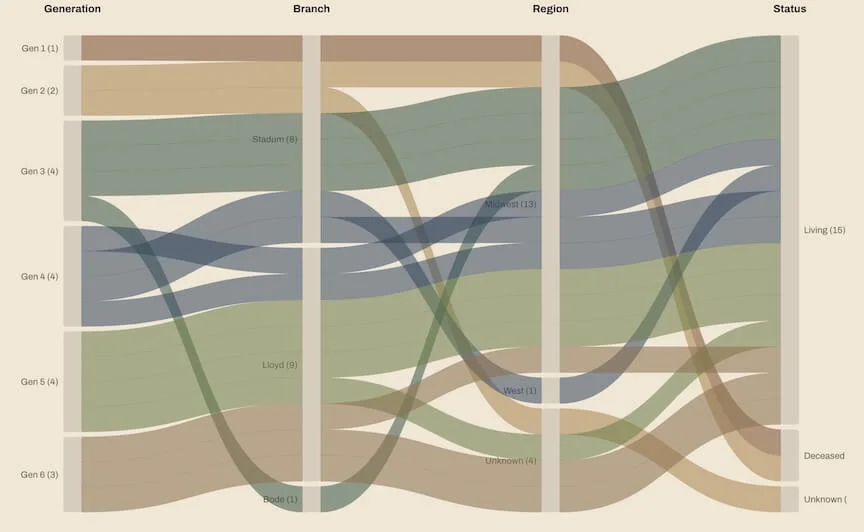
D3.js v7 · Flow Diagram
Sankey-style flow diagram showing how John Stadum's family grows and splits across generations, branches, geographic regions, and living status — all in one linked view.
Interactive
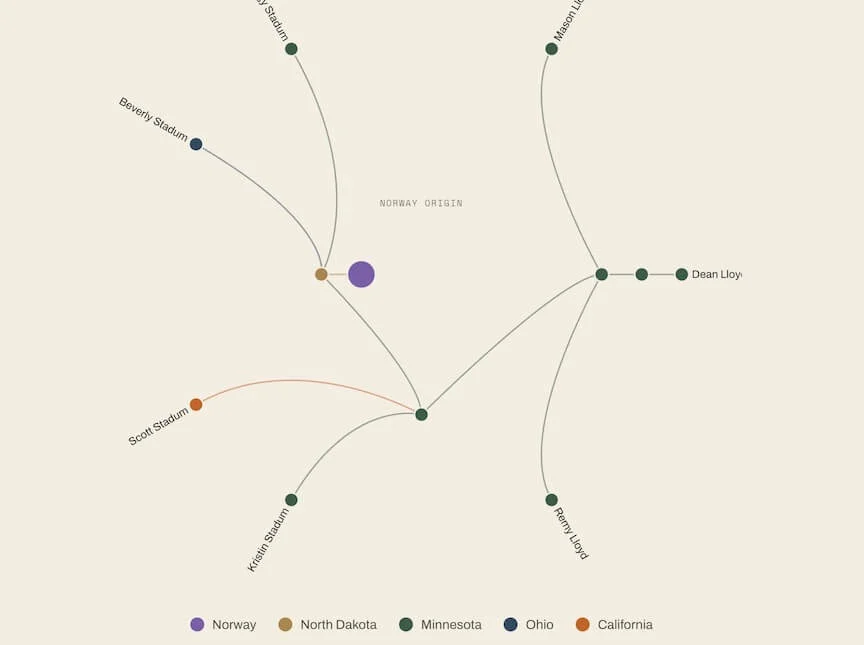
D3.js v7 · Radial Layout
Radial phylogenetic-style tree mapping where each family member lives. Branches radiate outward from the Norwegian origin — from Rugby, ND to Ohio, Minnesota, and California.
Interactive
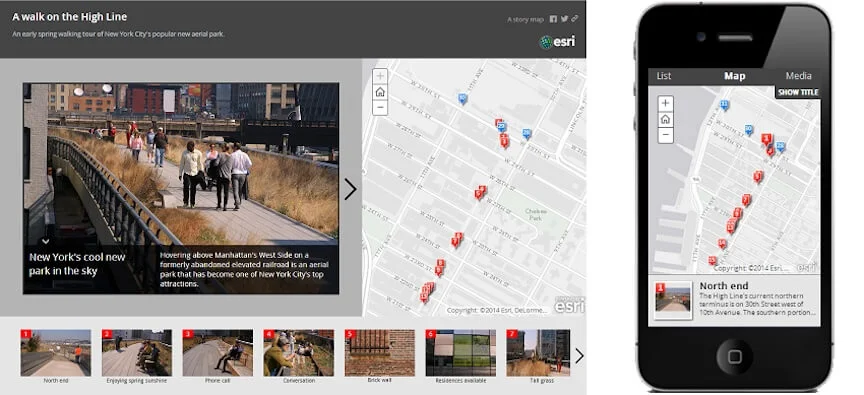
Esri · Place-Based Narrative
Linear, geo-located photo narrative — each stop on the map opens a photograph and caption. Designed for place-based family stories: the Broe Township homestead, Rugby, Cando, and the Norwegian origin in West Gran.
Interactive
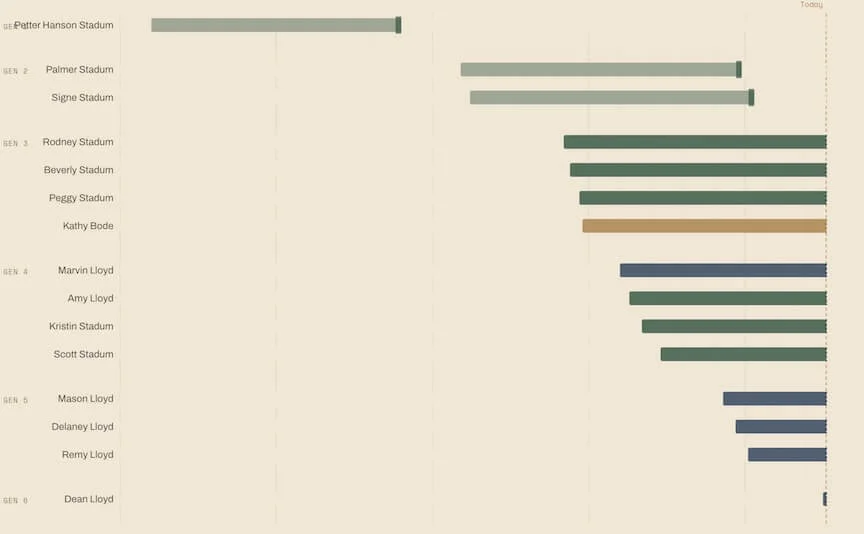
D3.js v7 · Lifespan Chart
Horizontal lifespan bars for every family member from 1800 to 2026 — styled like the Priestley biographical timelines. Six overlapping generations in one view, colored by family branch.
Interactive
Constellation Graph · Custom JS
Experimental layout demonstrating 10 non-linear navigation patterns. Connected pages (Palmer, Baker Electric, REA, Locomotive) are bridged by a shared constellation graph and backlinks.
Interactive

D3.js v7 · Leaflet · Migration Map
Animated migration flow map tracing Norwegian emigration to the American Midwest — from Valdres to Rugby, North Dakota — driven by the Homestead Act of 1862.
Interactive
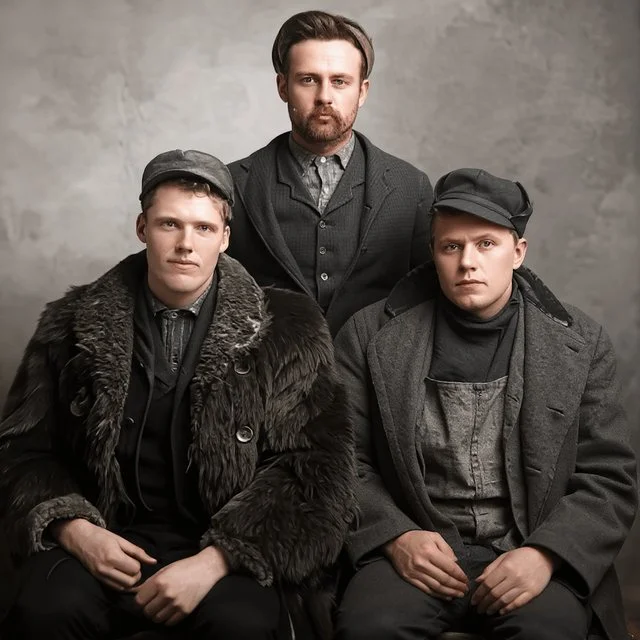
Hume AI · Expressive TTS
Hear the family archive read aloud in an expressive AI voice. Six passages from Palmer, Signe, Beverly, and Scott's chapters — voiced by Hume's American Lead Actress.
Experimental
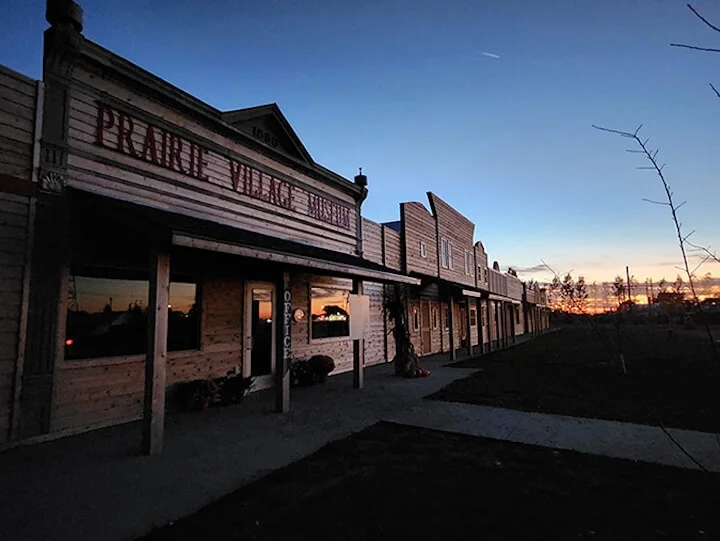
Google NotebookLM · AI Research
Curated list of every archive document ready for Google NotebookLM — timeline JSONs, biographical text, transcriptions, and story pages — with suggested research questions for each.
Reference
Data Files
Lab Data Files
All data files are hosted at /labs/data/ and usable by any external tool that accepts a public CSV URL.
CSV · TimeMapper
Family timeline events — 40+ entries from 1912 to 2025. Used by TimeMapper.
CSV · Palladio
Family people data — 16 individuals across 6 generations with birth coordinates. Used by Palladio.
CSV · Palladio Map
Family places data — 17 places with coordinates and connected people. Used for Palladio Map view.